There is no point in gathering data unless you can read them and use them for the business
Modern business organizations operate within processes that generate a large amount of valuable data. Data mining, then, is about analyzing, which deals with acquiring insights into the semantics of the actual business process accurately.
The presented visual components support getting maximum value in the shortest possible delivery time by targeting data and process content.
| Client | Data Strategy and Big Data Enablement Company |
|---|---|
| Business need | database integrations via flow diagrams |
| Scope | flow diagrams, database diagrams, interactive dashboard |
| Technology | GoJS |
Solution overview
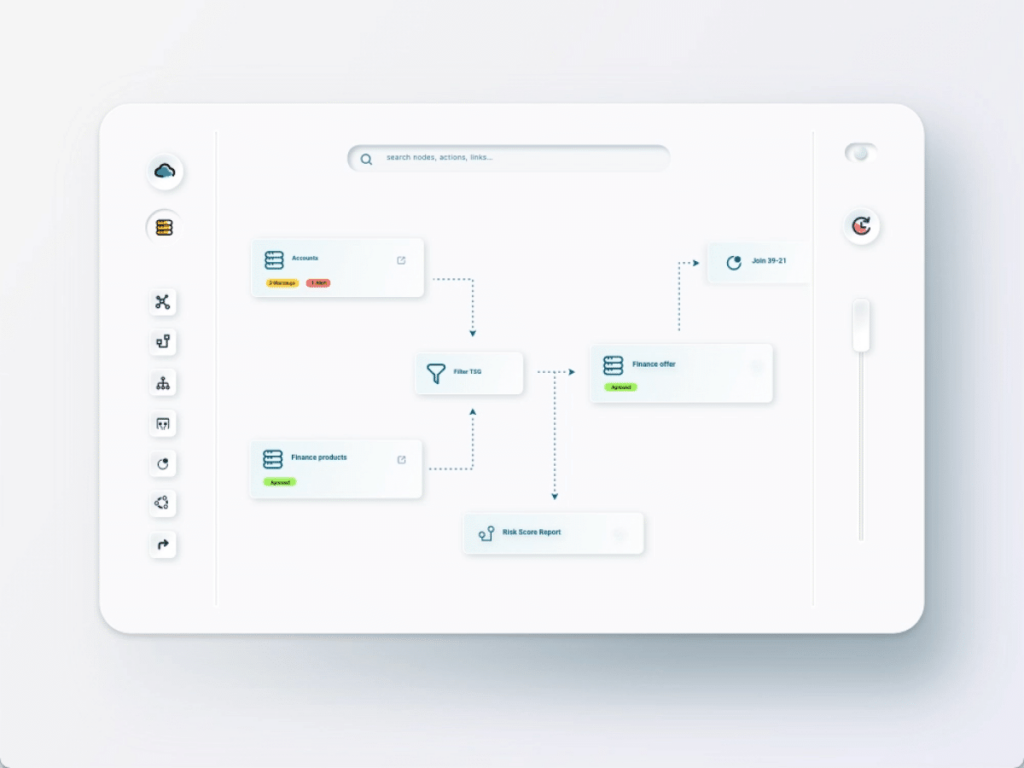
Database flow
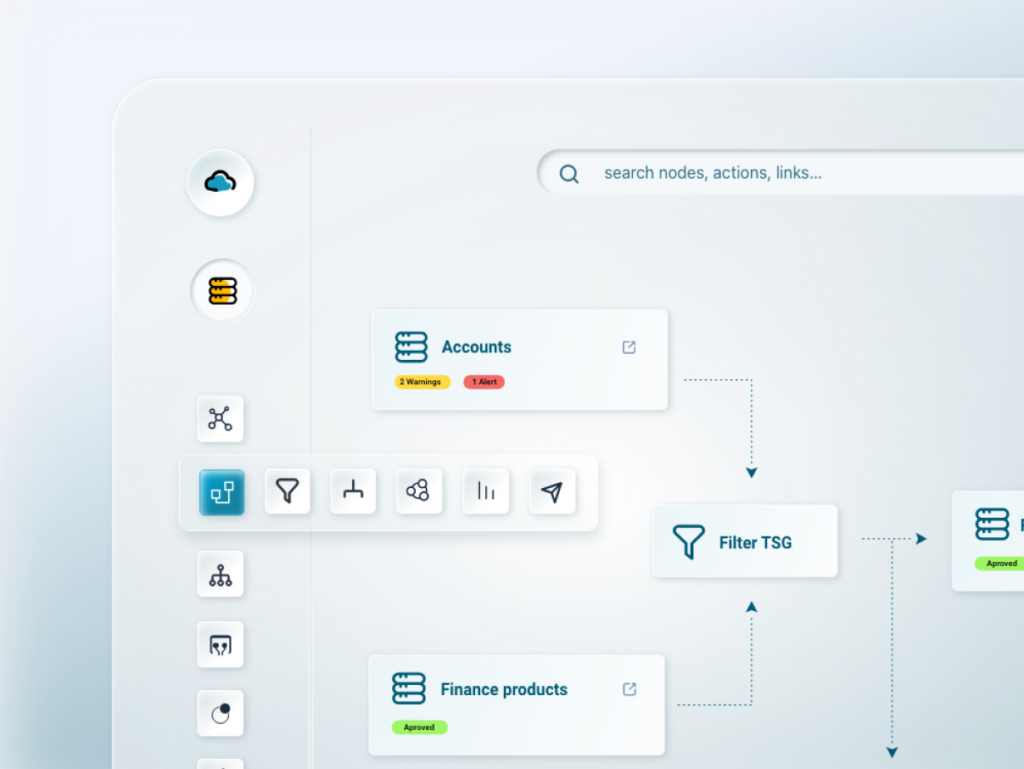
The database flow enables the helicopter view on the IT infrastructure. It consists of the central diagram that depicts the databases’ correlations. The graph presents the information flow and dependencies between the databases. Each data flow can be followed through the filters and take actions.
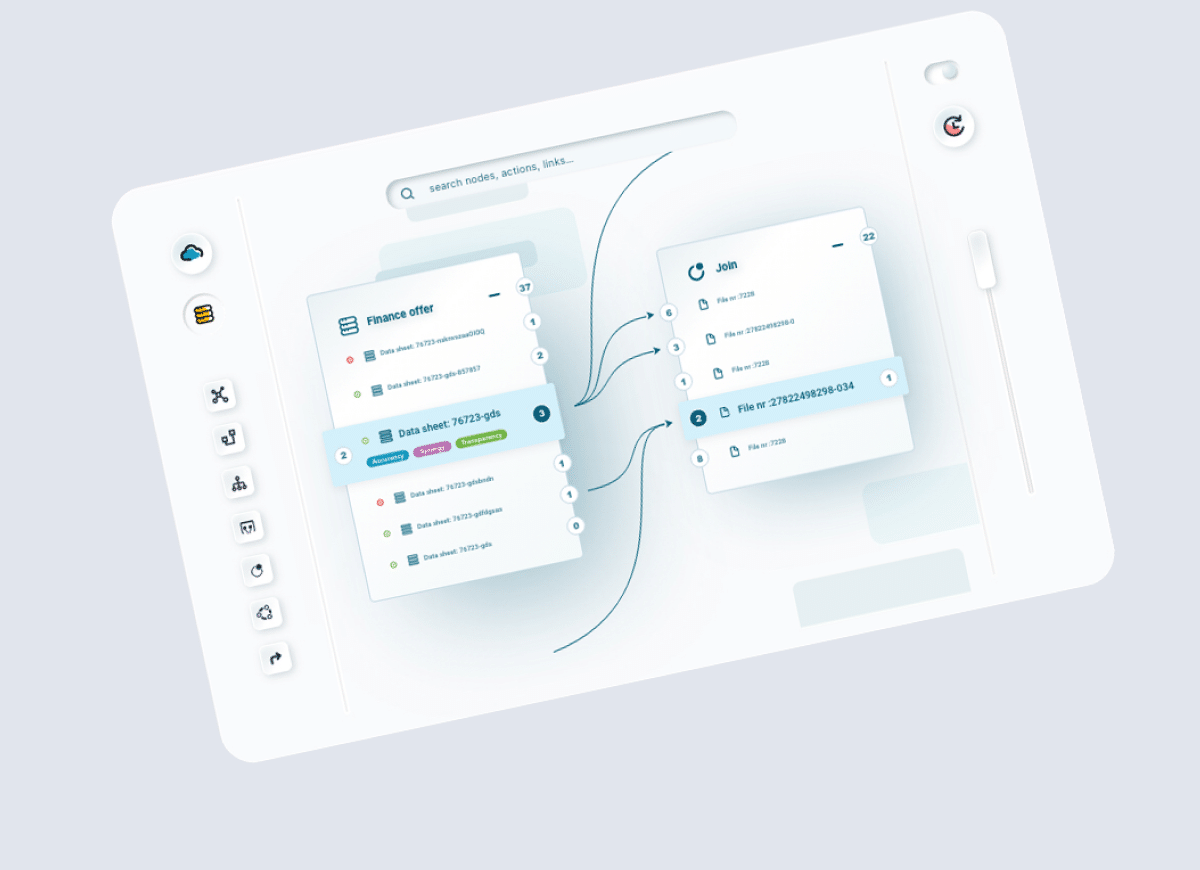
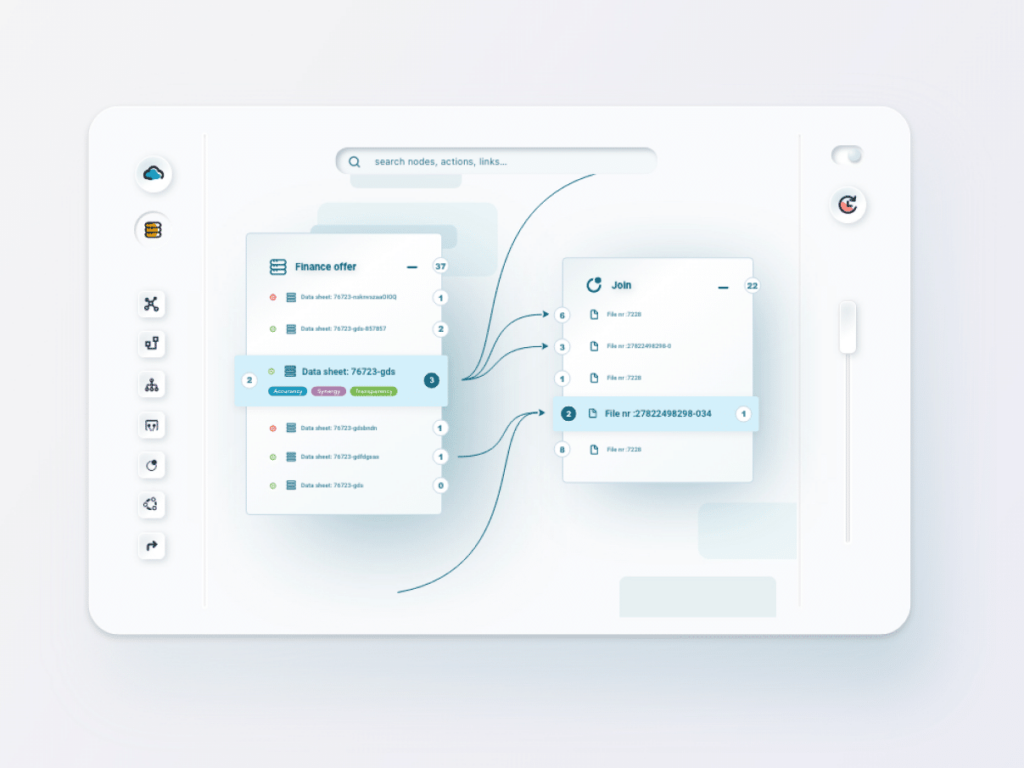
Databases correlations
The user can dive through specific information flow anytime. The expandable nodes showcase the details within them. By clicking the node, the user discovers dependencies between databases, filters, and actions. On the other hand, the highlighted arrows enable investigating the input and output correlations along with their origins.
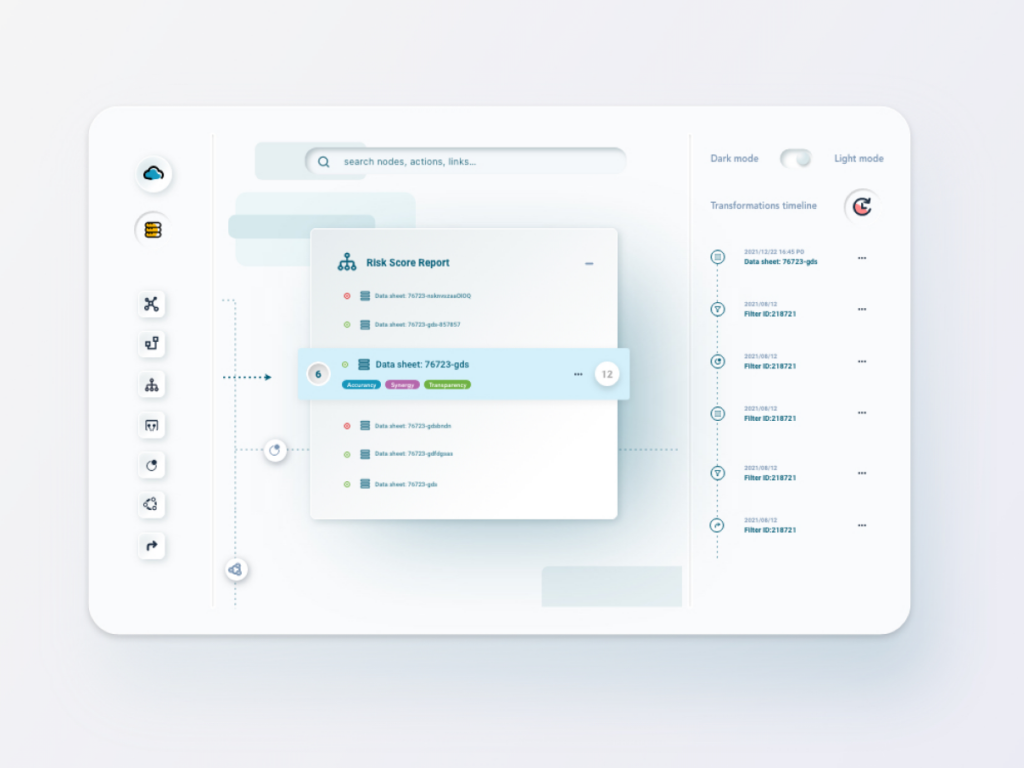
Database timeline
The timeline equips each record to present changes during a specific time. The integrated table component enables the user to look over the particular data sheet within the app.
Extended graphical interface
The two vertical sidebars enrich the graphic user interface. It enables submenu usage with more specific functions. The diagram itself is equipped with intelligent adornments to showcase the alerts within it.
Analyze your data effortlessly
Visual components make reading data easier and almost effortless. Thanks to the interactive dashboard, you can control and maintain your data and analyze how they change during a specific time.
An intuitive graphic user interface helps you navigate through nodes, arrows, and other components and easily find the needed databases with their contents.
Benefits of process and data mining solution
Effortless dashboard and diagram maintenance thanks to intuitive and extended graphic user interface
Presenting the information flow and dependencies between the databases
Analyzing changes during specific times thanks to an easy-to-read timeline