Simulations with the use of interactive diagrams allow you to test the operation of a tool, system, or data flow. Conducting a well-planned simulation leads to recognition of any faults or improper system functioning resulting from irregularities related to the components used in a given system.
Here’s a description of the use of
read more

The story of Łukasz Jaźwa, who combines the roles of a leader and a senior developer
A senior developer is a good candidate for a leader because such a person can accurately guide less experienced team members, indicate areas for improvement, or propose a development direction – told us Łukasz Jaźwa, Senior developer and Product Design team leader at Synergy Codes. We talk to Łukasz about his career path, which he has been pursuing for eight years in one organization. What are the advantages and disadvantages of working in the same company?
What made you tied your career with one company?
I think that my decision was influenced by many factors: great, family atmosphere, employment…
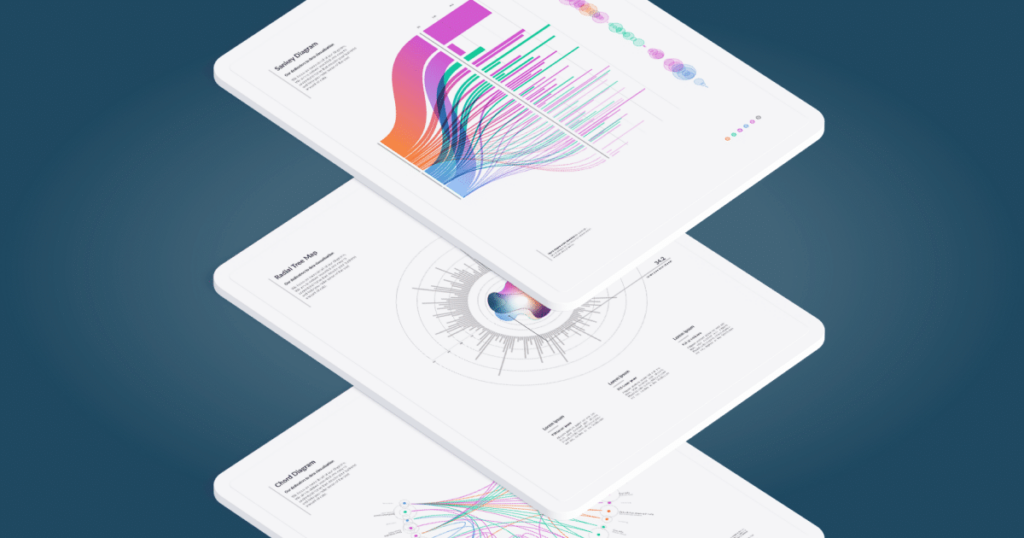
Seven great examples of custom diagrams and graphs usage for business
Data is a constant element of business. Presenting data via custom diagrams and graphs, they become a source of knowledge. What is more, they change into a powerful analytical tool that has a huge impact on the functioning of the business. The diagrams and graphs themselves provide the basis for well-presented data, its understanding, and use.
Learn seven examples of the real-life use cases of custom diagrams and graphs in business.
Diagrams and graphs differences.
But before we get to the icing on the cake, it’s worth knowing the fundamental difference between diagrams and graphs.

Custom Business Diagrams – Importance, Use and Examples
Most companies and corporations support their processes with various tools. Thus, the business diagram is a natural environment for working with the data that make up any processes. Custom business diagrams enable clear data view, even for less experienced employees. As a powerful solution, the business diagram can support decision-making and business processes by optimizing the communication between employees or departments. The below article tells the story of the custom business diagrams – their importance, use, and examples.
The use of custom diagrams also has a positive effect on business and project management. Data management can occur at various stages of work in the project, so the use of appropriate diagrams is not only a…
A complete guide to GoJS JavaScript library
Created by developers for developers, the GoJS is a skyrocket JavaScript library dedicated to building interactive diagrams and graphs. While being the most trustworthy resource, GoJS has been adopted as one of the most useful libraries for data visualization tools’ crafting.
The article covers the business and technical benefits of the GoJS library. To dive deeper into the topic, you can download the GoJS e-book. It’s a comprehensive publication filled with the knowledge and experience related to technical and business GoJS aspects
Introduction to GoJS diagramming library
The GoJS library was launched in 2012 by Northwoods Software – a tech company focused on providing…
Stay tunned
To be always updated, share your e-mail and subscribe to our newsletter to get the freshest feed from our blog.
[mailpoet_form id=”1″]

