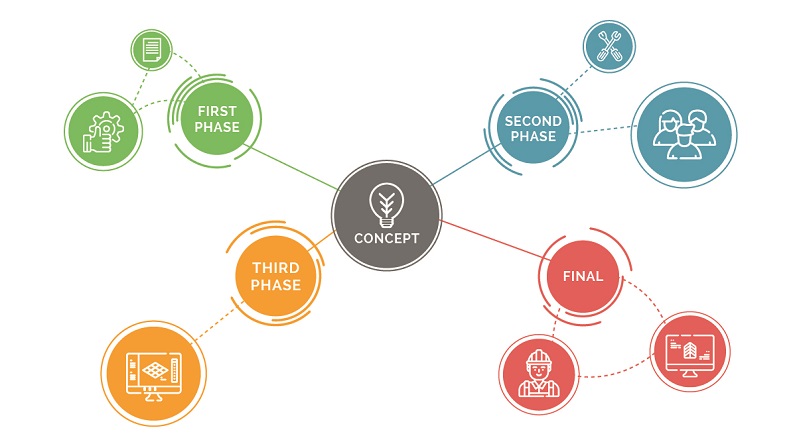
There are so many elements to coordinate when you’re running an event company. Your clients’ ideas are getting crazier and crazier, your budget is limited, time is running out, and suppliers are knocking at your door. At the same time, exhibitors are eager to see a visualization of the event space and the sound system provider is…
read more
Simple GoJS Application. Palette and Finishing Touches
Recently I’ve explained how to create a GoJS diagram, as well as how to set and style edges. In order to make the diagram fully interactive, we still need to give the option of inserting elements. To do this, we’ll create a palette built into GoJS.
Figure 1. Diagram after proper configuration of the ports
A palette is a separate canvas that displays all the nodes defined in it and allows you to transfer them to the main diagram. It is configured in a manner analogical to the diagram, but through the creation of a go.Palette object. However, in order to do this, we should first…
Simple GoJS Application. Setting and Editing Edges
In the last post I showed you how to get started with a GoJS application. I explained how to create a diagram and how to present data using it. Let’s go a step further.
Figure 1. Diagram with three templates for nodes
While our diagram is starting to look better, there are a few issues that stick out. First – it can’t be edited (the only thing you can do is move the nodes around and clone them using the CTRL key), and second – we might want the edges to be drawn between specific points of the nodes. This is particularly visible in…
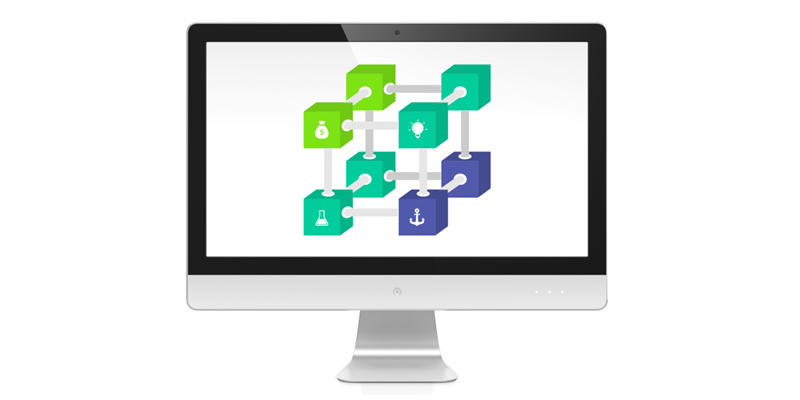
How do I create a simple GoJS application?
In this article, I will present the basic capabilities of GoJS by creating an application with very simple code. It will be designed for drawing uncomplicated diagrams.
START WITH THE LIBRARY
GoJS is a JavaScript library that takes complex data and runs it through flexible modeling options to create visualizations that are easy to understand and put into action.
The starting point for us is the HTML file where we import the library. We can download it directly from the website, from the npm, or we can use the CDN. The next step is to add the div element – the future location of the diagram. NOTE: We don’t…
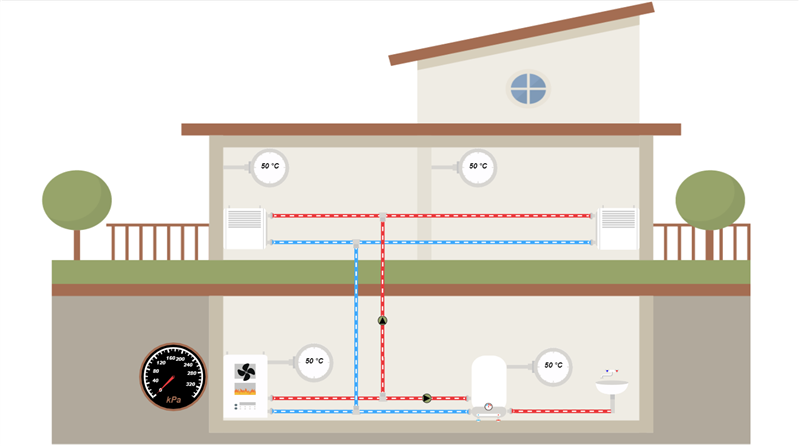
Real-time data visualizations with GoJS
We are witnesses to the fourth industrial revolution, which is no longer just a bold vision of the future. The widespread use of the IoT and the cloud is optimizing business processes while reducing costs. This article describes how data can be sent to a server in real-time and then visualized using a GoJS library.
It is becoming increasingly common for machines to communicate with one another and automatically send error notifications that wind up in the cloud application. A prominent place in this trend is occupied by the IoT (Internet of Things), which allows users to analyse the activity of various electronic devices without needing to use metering tools. This kind of solution…
Stay tunned
To be always updated, share your e-mail and subscribe to our newsletter to get the freshest feed from our blog.
[mailpoet_form id=”1″]

