A new person in the company’s structure, regardless of whether it’s a project or a team, always arouses emotions, not only in the person concerned but also in the leader and recruiters. A newcomer on board is a harbinger of changes that the company needs at some stage in its development. And of course, when looking for…
read more

Benefits of a tool for intelligent building management
Intelligent buildings are no longer a futuristic sci-fi vision. Dedicated information systems called Intelligent Building Systems, which enable broadly defined building automation, are increasingly used to support the administration and operation of buildings. This trend has become an inspiration to create the Smart Building application, which was created by our Product Design team. This tool, among others, visualizes data collected from sensors located in rooms for convenient and smooth management of environmental conditions in the offices. The creation of the application supported by dashboard visualization is a response to the needs of having a 360 tool for intelligent building management, from the stage of space design and placement of sensors, through their real-time…

Data.Depicted Episode 4: Visualize processes. Introduce changes faster.
You’re a manager that searches for savings in your enterprise, which are a real bane. No wonder, these are, among others, the elements necessary to maintain production lines. Consequently, the savings make the sales bars appropriately high. Not even mentioning the daily work improvement. However, all of these activities aren’t resistant to introducing further changes within processes. The question is, then, how to manage them to optimize processes as much as possible, and at the same time, generate savings? Can interactive data visualization and process modeling tools support making changes?
How to change the process
Looking at manufacturing companies, it’s not difficult to conclude that most automation…

Data.Depicted Episode 3: Remove Excel data smoke. Fire up the team
Let’s imagine a typical situation, which (unfortunately) is commonplace in many companies. One of the responsibilities of managers is reporting using data placed in an extensive Excel visualization spreadsheets. Working on this type of tool can be troublesome for several reasons. Often, it is the employee’s responsibility to find a solution that will allow them to do their job as quickly as possible, especially when it comes to excel visualization. Therefore, formulas, macros, and other facilities are created internally for the data contained in Excel. In turn, work on internal tools and managing Excel visualization dashboards aimed at working with an extensive worksheet is not obvious and easy to implement for every employee. The element of the…
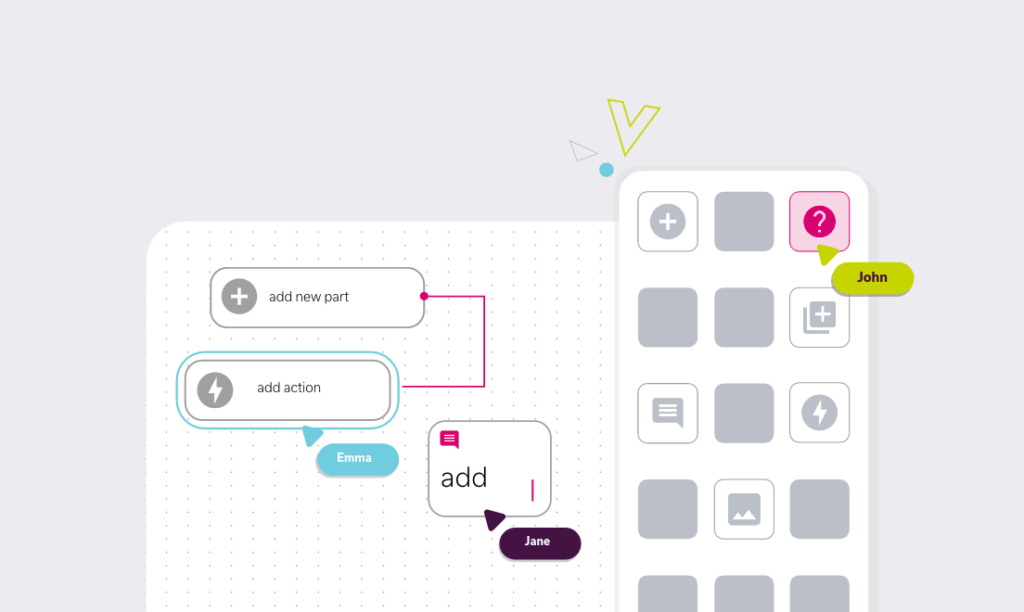
5 steps on how to improve team efficiency via the real-time collaboration tool
The current outbreak of coronavirus has caused many significant business transformations. Manufacturers, managers, and directors faced the challenge of turning the process design into the remote. Many entrepreneurs are looking for solutions among the tools that will ensure the trouble-free continuation of current processes, so that the work can be done partly remotely, without incurring financial and time consequences. If you design activities, pilot projects, model processes, or simply manage the development of various types of solutions for your company in cooperation with numerous departments, you may face several issues. These include, among other things, communication errors that can affect a mutual understanding of priorities and outlined roles when delegating tasks to the project. All this can…
Stay tunned
To be always updated, share your e-mail and subscribe to our newsletter to get the freshest feed from our blog.
[mailpoet_form id=”1″]

