It’s a hard nut to crack to present a huge amount of complex data in 2D canvas. The most critical issue is obtaining a readable system of relationships between nodes with data, with a minimum number of edge crossings. We’d add fast data rendering as well. If you deal with the challenge of ‘stuffing’ your data into…
read more
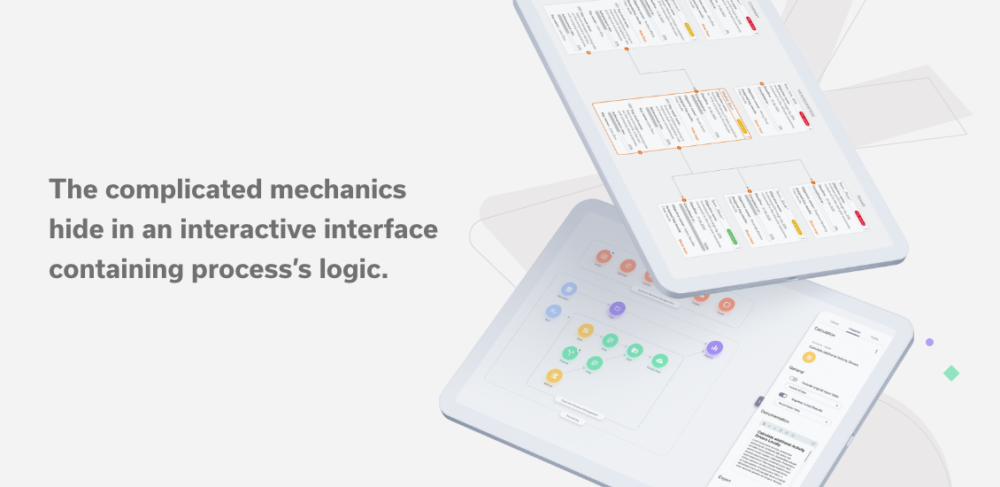
Economizing diagrams. The route to a simple realization of the nodes
To talk about what diagrams are, from a definition point of view, would be reinventing the wheel. However, the fact that they are commonly used in the business is a topic we encounter in our daily work. But Łukasz Jaźwa, who holds the role of Senior Software Engineer and Product Design Team Leader at Synergy Codes, will tell you how to manage data using diagrams as an advanced form of visualization and presentation.
Yet, it’s impossible to ignore an attempt to discuss what diagrams mean to us. We’re a team of specialists who help clients from all over the world to present complex data and processes in the form of tailor-made diagram applications in…

4 steps to optimize the project with full control and live cooperation
Any manager or a team member, working on a project, encounters some typical issues. While you have deadlines to face, the reality of remote work doesn’t make anything easier. So why not look for the tools that will allow you to control and fully optimize your project? The effective solutions for live cooperation within the project are just around the corner.
Is it possible to obtain the effect of full optimization and taking control of the project in 4 steps? Yes, if the manager can delegate tasks to the team, sets the appropriate deadlines for each stage, maintains constant communication, and responds to the crisis immediately. At the same time,…

Data-driven UX – how it can improve creating data vis apps
When designing data visualization, as designers we need to understand the users’ intentions for interacting with our product and what answers to their questions they are trying to find. Typically, during the design process, user flow consists of a series of steps, which they usually finish with an action, such as buying a product, starting an operation, etc. The goal in this case is concrete and clearly defined. However, it is not all cracked up to be when the goal itself is not just to reach desired data but its exploration and analysis, during which a user can perform several actions.
Let’s start with what is

Road to IT career – is it possible without experience?
Opening doors to the IT industry isn’t a piece of cake for a beginner, mainly because of the lack of experience. This issue is common for many industries, however, it seems to be a real challenge in IT. It’s not only the time that a newcomer needs to introduce himself. It happens that more experienced workers need to devote their time to the rookie to help him start the IT journey.
It all started in high school. This is where I started to be keen on programming. I kicked off some websites and applications not only for my personal use but also for friends and family. Being aware that many IT companies are looking…
Stay tunned
To be always updated, share your e-mail and subscribe to our newsletter to get the freshest feed from our blog.
[mailpoet_form id=”1″]

