Category: Data Visualization - page 2
Anyone who has ever had to make an audit for regulatory compliance, optimize or debug a data-driven process, has probably found themselves asking: “Where did this data come from?” In other words: they found themselves looking for data lineage. Chances are, this search, when done manually, led to hours wasted in reading code and reverse-engineering algorithms.…
read more
Why use UML Class diagrams?
Data visualization techniques, especially diagrams, based on the achievements of front-end development allow you to understand data much faster and easier. Diagrams enable a better perception of data than plain text by documenting different systems. Therefore, if you ask yourself whether the use of diagrams is right for your organization – we suggest trying it. Get to know UML Class diagrams, which can significantly facilitate working with data, debugging to find problems, planning development processes, or optimizing existing systems or programs.
What are the UML Class diagrams?
The UML Class diagrams are graphical notations used to visualize and construct object-oriented systems. To be more specific, a class…

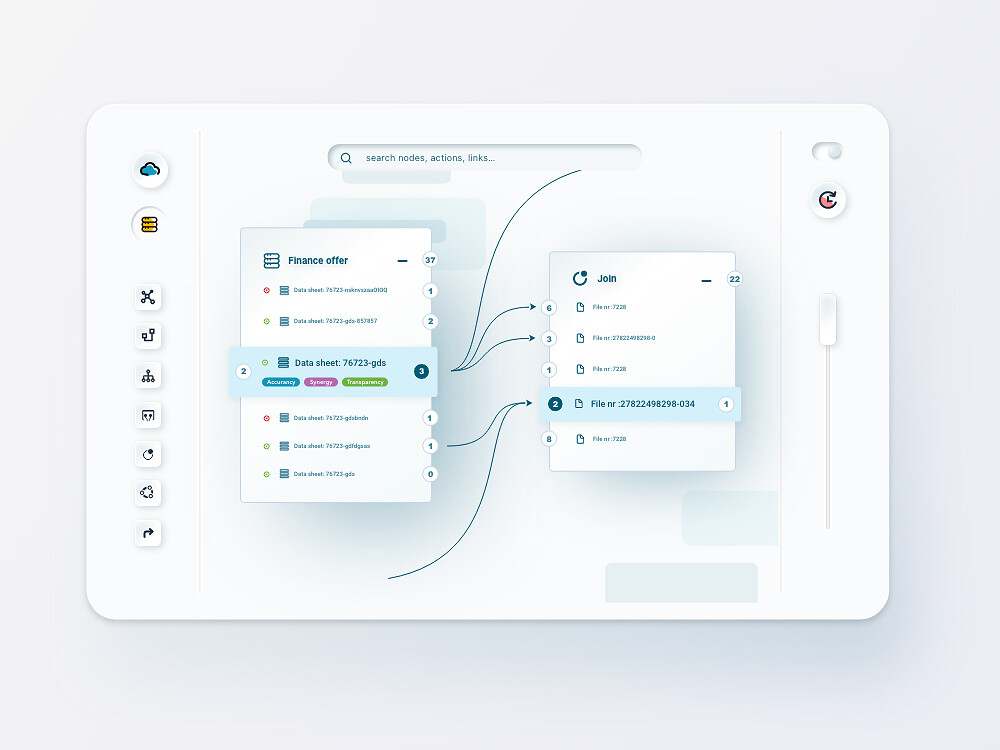
How can data-driven companies leverage system architecture diagrams?
Enterprise IT architecture, or system architecture, is a hybrid environment of applications and systems distributed across on-premise data centers, cloud infrastructure, edge computing, IoT networks, and other platforms. It spans different physical locations of the machines and various service providers, whether a company uses IaaS, PaaS or SaaS solutions, or a hybrid environment. Let’s see how system architecture diagrams may provide a visible change for data-driven companies.
While this distributed setup offers many advantages, such as flexibility, security, rapid time-to-market, and customization, a complex infrastructure and software architecture is a challenge for data governance and system administration. It’s not as simple as server-to-server data flow mapping that was common…
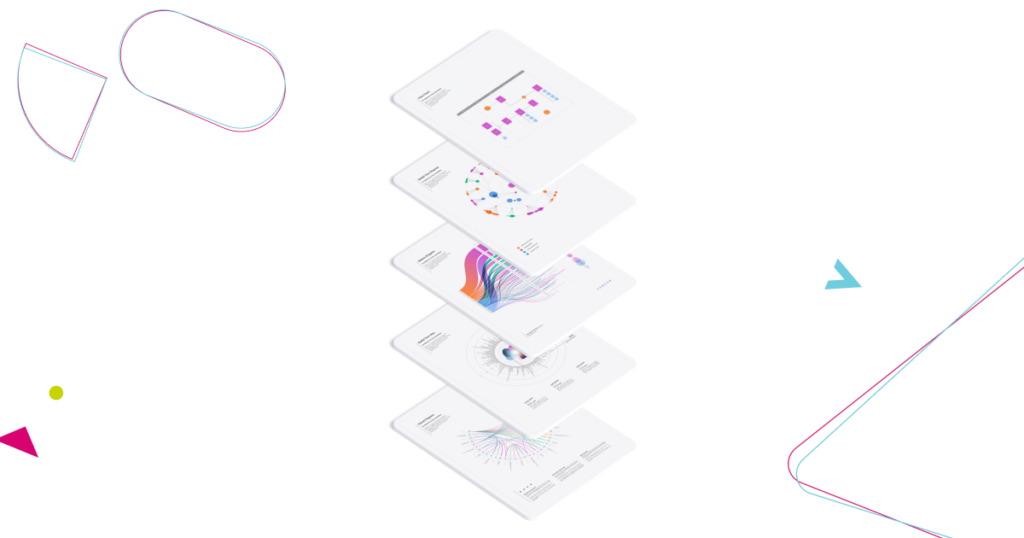
How to avoid ten common mistakes in data visualization?
John W. Tukey, the founding member of Princeton’s statistics department and the author of the software term, once said that if you torture the data long enough, it will tell you anything. His work of life was to take boring, flat data and bring it to life through visualization. However, he was aware of the misconstructed data. It leads to publishing misleading visualization, which results in the audience’s mistrust. Let’s check then what design factors make visualizations stand out? How can designers convey the meaning of data with desired clarity? Read the article to find out.
How do we perceive data?
Data visualization focuses on human sight, and cognition is the most incredible natural phenomenon. Human brains work in such a way as to catch the most critical…
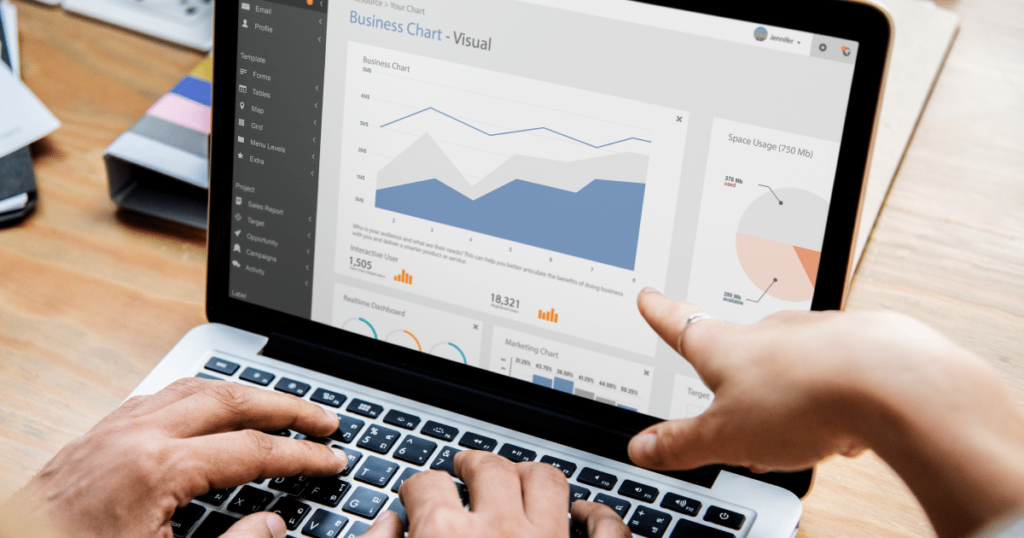
Data Visualization Trends For The Upcoming Future
Visualization is quickly growing in importance in the world of big data. Businesses can no longer afford to operate without graphs and dashboards in their arsenal since they’re extremely useful for presenting and understanding complex information. All the technology surrounding us, and mobile devices, in particular, has turned into data sources that changed the way organizations collect and crunch numbers with the goal of generating actionable insights. The best way for humans to perceive complex data is by means of sight, so in this post, we’ll have a look at data visualization trends in 2021 and beyond that will help you get the most out of your analytics.
As per
Stay tunned
To be always updated, share your e-mail and subscribe to our newsletter to get the freshest feed from our blog.
[mailpoet_form id=”1″]

