Data and Process Flow Diagram for Enterprise Software and Services Provider
Enterprise-level companies deal with a large amount of information and processes which needs to be planned, managed and controlled. We put up a challenge to create a tool for a Market Leader in Enterprise Application Software.
The solution capture the details of the tasks and interactions with a process, and augment the business process model with the corresponding information flow.
| Client | market leader in enterprise application software |
|---|---|
| Business need | business processes and information flow |
| Scope | web based UI, diagramming, dashboard |
| Technology | GoJS library |
Solution overview

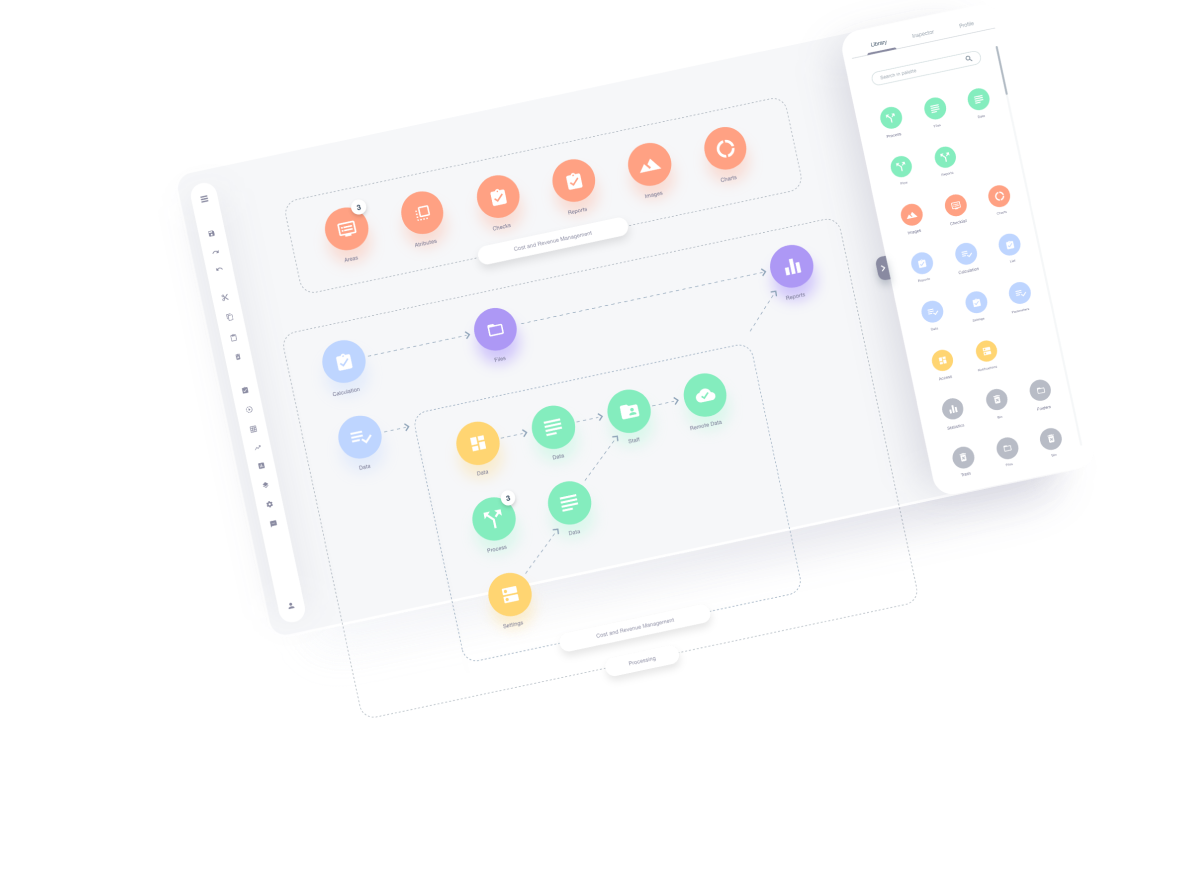
Expandable Process Flow Diagram
Look at the company from helicopter view. In our solution, we have implemented multi-level nesting of nodes, which break into subsequent sections until the visibility of several thousand objects. Moreover, the expanding node disappears, making room to show under the structures.
Personal Gantt Chart
To get deeper into the context of a specific project, we have prepared a Gantt chart view, in which we assign people whose image is displayed on bars to tasks. Additionally, we have implemented a mini-map, which is a useful preview of the entire chart.


Advanced Sidebar Menu
We reconciled the possibilities of GoJS with the client’s expectations by adding as many as 25 different controls in the data inspector / property sidebar, such as free text, dropdown, radio button, document, etc.
Online Spreadsheets Embedded
The solution has a built-in handsontable system, i.e. the equivalent of word / excel documents, which allows you to add any content to a document or sheet in any object. The sidebar options also allow you to upload ready-made files.

Custom Data Flow Diagram Gives Your Data a Big Picture with Expandable Details
The Business Process and Information Flow solution best fits enterprise-level companies that deal with many information and processes. The tool enables planning, managing, and controlling any processes and data within the company. With an information flow diagram accompanied by interactive dashboards, the user gets the tool to grasp the big picture of data with expandable details.
It captures the details of the tasks and interactions with a process and augments the business process model with the corresponding information flow. Better support of information flow is being managed via documentation. Except for helping the managers, the solution assists human resources management.
Undisputed Data Flow Diagram Benefits
enabling big picture overview with expandable details
supporting organizational documentation flow
uplifting cooperation between departments